Exporting logs to external service
This guide assumes that you have Kurtosis installed.
Kurtosis comes with a logs aggregator component that aggregates logs from services across enclaves. This component uses Vector under the hood. Logs aggregator can be configured independently for each cluster, in the Kurtosis config file.
Kurtosis (and Vector) uses the notion of "sinks" to describe the location where you want your logs exported. Sink configurations are forwarded as-is (with some exceptions, see below) to Vector, therefore Kurtosis can export to all sinks that Vector supports. For a complete list of supported sinks and their configurations, please refer here.
The following guide walks you through the process of setting up a local Elasticsearch/Kibana instance to which Kurtosis will forward logs to. We also include configuration examples for common sinks, such as AWS OpenSearch, S3, etc.
Prerequisites
Before you proceed, make sure you have:
- Installed the Kurtosis CLI (or upgraded it to the latest release, if you already have the CLI installed)
- Installed and started the Docker engine on your local machine, if you are using Docker, or,
- Have a local or remote Kubernetes cluster, installed kubectl and configured Kurtosis to work with this cluster, if you are using Kubernetes. For the purpose of this guide, we will be using Minikube
Guide for Docker
Starting a local Elasticsearch/Kibana instance
Start an Elasticsearch container with the following command:
docker run -d --name es01 --net bridge -p 9200:9200 -p 9300:9300 -e "discovery.type=single-node" elasticsearch:8.17.3
Note, the network must be set to bridge for the logs aggregator to be able to connect to Elasticsearch.
Start a Kibana container with following command:
docker run -d --name kb --net bridge -p 5601:5601 kibana:8.17.3
Generate an Elasticsearch enrollment token with the following command:
docker exec -it es01 /usr/share/elasticsearch/bin/elasticsearch-create-enrollment-token -s kibana
Access Kibana at http://localhost:5601 and paste the enrollment token generated by the command above. Subsequently, Kibana
will ask you for a 6-digit verification code. To view this code, access Kibana container logs:
docker logs kb
Next, Kibana will ask you to sign in. The username for the local Elasticsearch instance is elastic, and you can generate
the password with:
docker exec -it es01 /usr/share/elasticsearch/bin/elasticsearch-reset-password -u elastic
You have now successfully started an Elasticsearch instance.
Configuring Kurtosis to send logs to Elasticsearch
Locate your Kurtosis configuration file with the following command:
kurtosis config path
Determine the IP address of your Elasticsearch container by running the following command:
docker inspect -f '{{.NetworkSettings.Networks.bridge.IPAddress}}' es01
Open the configuration file and paste the following content, replacing <PASSWORD> with the Elasticsearch password generated
in the previous section and <ELASTICSEARCH_IP_ADDRESS> with the IP address of your Elasticsearch container:
config-version: 4
should-send-metrics: true
kurtosis-clusters:
  docker:
    type: "docker"
    logs-aggregator:
      sinks:
        elasticsearch:
          type: "elasticsearch"
          bulk:
            index: "kt-{{ kurtosis_enclave_uuid }}-{{ kurtosis_service_uuid }}"
          auth:
            strategy: "basic"
            user: "elastic"
            password: "<PASSWORD>"
          tls:
            verify_certificate: false
          endpoints:
            - "https://<ELASTICSEARCH_IP_ADDRESS>:9200"
config-version must be set to the minimum version of 3 for logs aggregator configurations to apply for Docker
tls.verify_certificate should not be disabled outside of testing!
Finally, restart Kurtosis engine to apply the changes:
kurtosis engine restart
Guide for Kubernetes
Setting up Minikube
Follow Minikube's official get started guide to download and start a Minikube cluster.
Starting a local Elasticsearch/Kibana instance
Create a Kubernetes manifest with the following configurations:
# elasticsearch.yaml
---
apiVersion: apps/v1
kind: Deployment
metadata:
  name: elasticsearch
  labels:
    app: elasticsearch
spec:
  replicas: 1
  selector:
    matchLabels:
      app: elasticsearch
  template:
    metadata:
      labels:
        app: elasticsearch
    spec:
      containers:
        - name: elasticsearch
          image: elasticsearch:8.17.3
          env:
            - name: discovery.type
              value: "single-node"
            - name: ES_JAVA_OPTS
              value: "-Xms1g -Xmx1g"
          ports:
            - containerPort: 9200
              name: rest
            - containerPort: 9300
              name: inter-node
          resources:
            requests:
              memory: "2Gi"
              cpu: "500m"
            limits:
              memory: "2Gi"
              cpu: "1"
---
apiVersion: v1
kind: Service
metadata:
  name: elasticsearch
spec:
  selector:
    app: elasticsearch
  ports:
    - protocol: TCP
      port: 9200
      targetPort: 9200
---
apiVersion: apps/v1
kind: Deployment
metadata:
  name: kibana
  labels:
    app: kibana
spec:
  replicas: 1
  selector:
    matchLabels:
      app: kibana
  template:
    metadata:
      labels:
        app: kibana
    spec:
      containers:
        - name: kibana
          image: kibana:8.17.3
          ports:
            - containerPort: 5601
---
apiVersion: v1
kind: Service
metadata:
  name: kibana
spec:
  selector:
    app: kibana
  ports:
    - protocol: TCP
      port: 5601
      targetPort: 5601
Apply the manifest with the following command:
kubectl apply -f elasticsearch.yaml
Generate an Elasticsearch enrollment token with the following command:
kubectl exec -it elasticsearch -- /usr/share/elasticsearch/bin/elasticsearch-create-enrollment-token -s kibana
Access the Kibana dashboard with the following command, and paste the enrollment generated above:
minikube service kibana
Next, Kibana will ask you to sign in. The username for the local Elasticsearch instance is elastic, and you can generate the password with:
kubectl exec -it elasticsearch -- /usr/share/elasticsearch/bin/elasticsearch-reset-password -u elastic
You have now successfully started an Elasticsearch instance.
Configuring Kurtosis to send logs to Elasticsearch
Locate your Kurtosis configuration file with the following command:
kurtosis config path
To allow the logs aggregator to connect to Elasticsearch, you would need either the DNS name of the service or its IP address.
For cluster with CoreDNS, the DNS name is in the format <service_name>.<namespace>.svc.cluster.local, which resolves
to elasticsearch.default.svc.cluster.local (using the manifest above). For cluster without CoreDNS, you may get the
service IP address with the following command:
kubectl get svc elasticsearch
Open the Kurtosis configuration file and paste the following content, replacing <PASSWORD> with the Elasticsearch password
generated in the previous section and <ELASTICSEARCH_ADDRESS> with the DNS name or IP address of the Elasticsearch service:
config-version: 4
should-send-metrics: true
kurtosis-clusters:
  docker:
    type: "docker"
  kube:
    type: "kubernetes"
    logs-aggregator:
      sinks:
        elasticsearch:
          type: "elasticsearch"
          bulk:
            index: "kt-{{ kurtosis_enclave_uuid }}-{{ kurtosis_service_uuid }}"
          auth:
            strategy: "basic"
            user: "elastic"
            password: "<PASSWORD>"
          tls:
            verify_certificate: false
          endpoints:
            - "https://<ELASTICSEARCH_ADDRESS>:9200"
    config:
      kubernetes-cluster-name: "minikube"
      storage-class: "standard"
Stop the current Kurtosis engine, if you had started one, using the following command:
kurtosis engine stop
Start the Kurtosis gateway with the following command:
kurtosis gateway
Switch to the kube cluster, which automatically starts a new engine, with the following command:
kurtosis cluster set kube
config-version must be set to the minimum version of 4 for logs aggregator configurations to apply for Kubernetes
Verify logs delivery
To verify that Kurtosis are actually exporting logs to Elasticsearch, start by running a package. In this guide, we use
ethpandaops/ethereum-package:
kurtosis run github.com/ethpandaops/ethereum-package
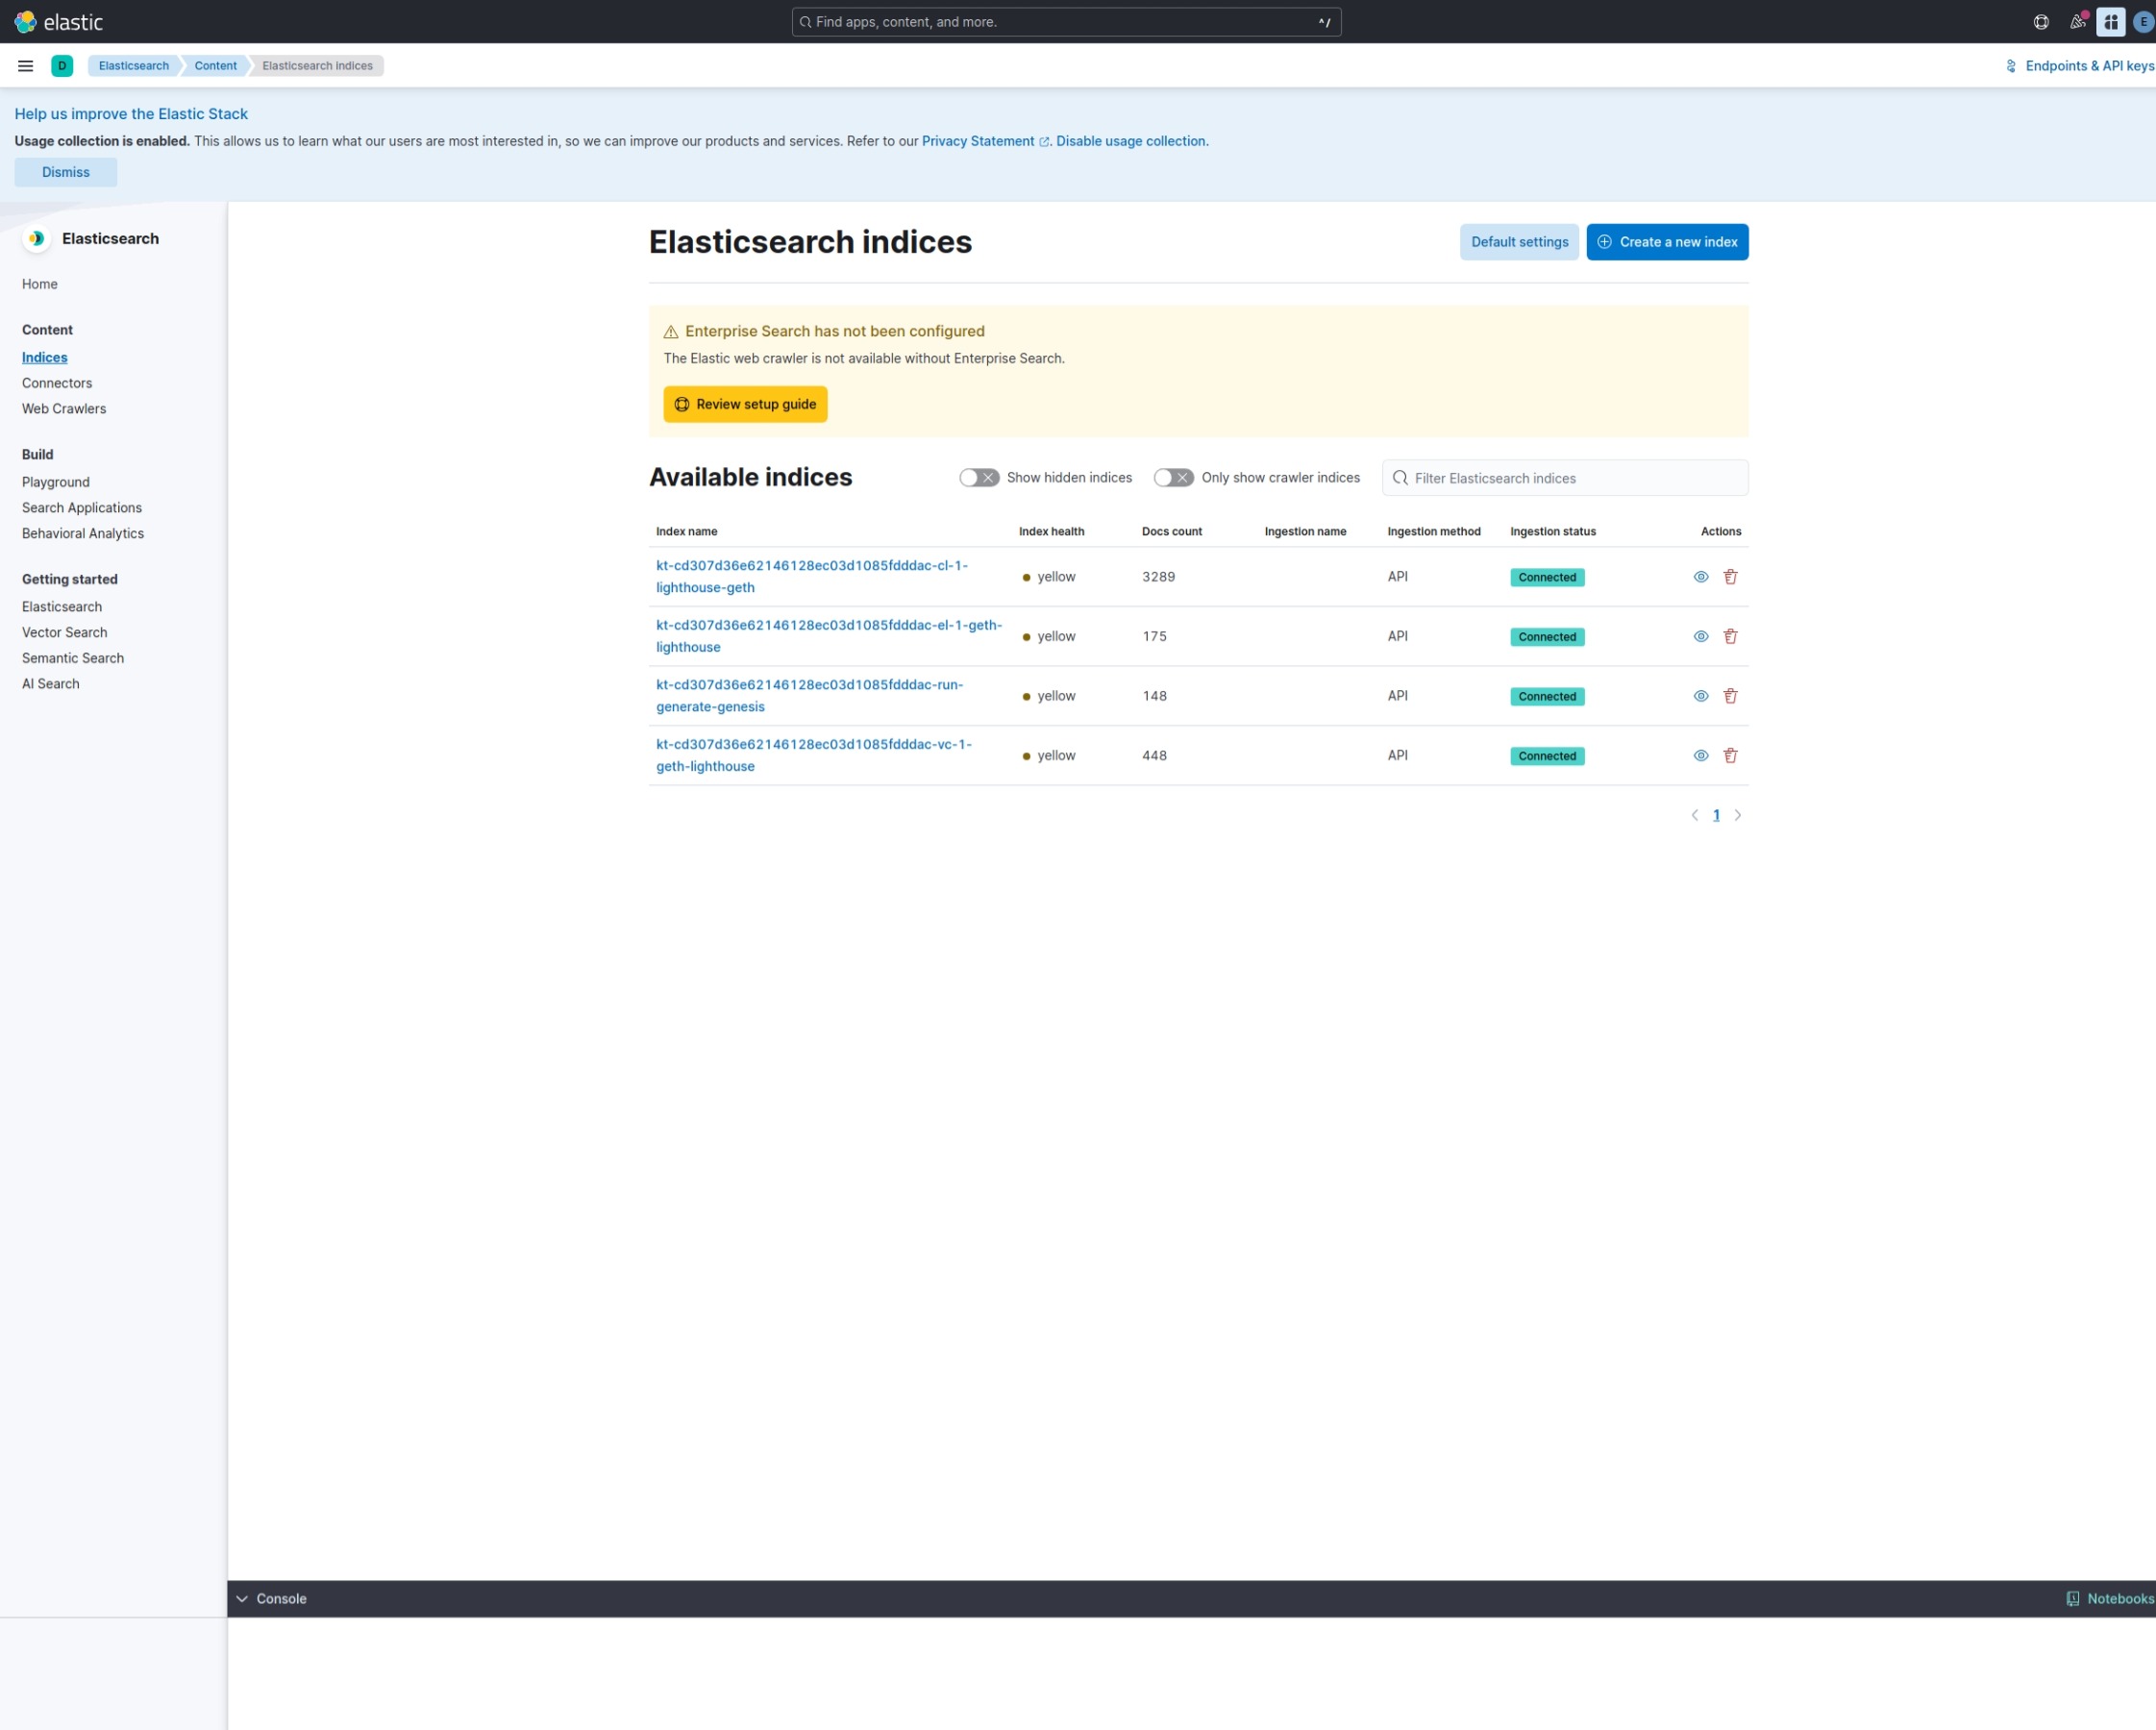
Once the package has finished execution, go to http://<KIBANA_ADDRESS>/app/enterprise_search/content/search_indices,
where <KIBANA_ADDRESS> depends on whether you use Docker or Kubernetes. Indices created by Kurtosis will the in the
format kt-{{ kurtosis_enclave_uuid }}-{{ kurtosis_service_uuid }} (as configured above)
This is what you should see if everything went correctly
Configuring other sinks
Kurtosis sinks configurations are one-to-one to Vector sink configurations, with the inputs field being injected automatically
by Kurtosis. It is not possible at the moment to specify a different input source. Please refer to the official Vector
documentation for sink configurations.
Below are examples of some common configurations that serve as good starting points for your custom sink configurations.
AWS OpenSearch Serverless
config-version: 4
should-send-metrics: true
kurtosis-clusters:
  cluster-name:
    type: "<CLUSTER_TYPE>"
    logs-aggregator:
      sinks:
        elasticsearch:
          type: "elasticsearch"
          opensearch_service_type: "serverless"
          bulk:
            index: "kt-{{ enclave_uuid }}-{{ service_name }}"
          aws:
            region: "<AWS_REGION>"
          auth:
            strategy: "aws"
            access_key_id: "<ACCESS_KEY_ID>"
            secret_access_key: "<SECRET_ACCESS_KEY>"
          endpoints:
            - "<OPENSEARCH_ENDPOINT>"
AWS CloudWatch
config-version: 4
should-send-metrics: true
kurtosis-clusters:
  cluster-name:
    type: "<CLUSTER_TYPE>"
    logs-aggregator:
      sinks:
        cloudwatch:
          type: "aws_cloudwatch_logs"
          region: "<AWS_REGION>"
          auth:
            access_key_id: "<ACCESS_KEY_ID>"
            secret_access_key: "<SECRET_ACCESS_KEY>"
          group_name: "<LOG_GROUP_NAME>"
          stream_name: "kt-{{ enclave_uuid }}-{{ service_name }}"
          encoding:
            codec: "json"
AWS S3
config-version: 4
should-send-metrics: true
kurtosis-clusters:
  cluster-name:
    type: "<CLUSTER_TYPE>"
    logs-aggregator:
      sinks:
        s3:
          type: "aws_s3"
          region: "<AWS_REGION>"
          auth:
            access_key_id: "<ACCESS_KEY_ID>"
            secret_access_key: "<SECRET_ACCESS_KEY>"
          bucket: "<BUCKET_NAME>"
          key_prefix: "kt-{{ enclave_uuid }}/{{ service_name }}/"
          encoding:
            codec: "json"
Configuring Log Filters
Kurtosis allows you to configure filters that get passed through to the logs collector, currently implemented using Fluentbit. These filters can be used to modify or filter logs before they are sent to the configured sinks from export logs.
The filters are configured in the logs-collector section of your Kurtosis config using version 6 or higher. Each filter has a name, match pattern, and parameters from the corresponding Fluentbit filter used.
Here are some examples of common configurations that might be useful in Kurtosis.
Basic Grep Filter
This example shows how to filter out logs containing specific patterns:
config-version: 6
should-send-metrics: true
kurtosis-clusters:
  docker:
    type: "docker"
    logs-collector:
      filters:
        - name: "grep"
          match: "*"
          params:
           - key: "exclude"
             value: "log .*DEBUG.*"
           - key: "logical_op"
             value: "&"
This configuration will exclude all logs containing the word "DEBUG" using the grep filter.
Multiple Filters
You can chain multiple filters together:
config-version: 6
should-send-metrics: true
kurtosis-clusters:
  docker:
    type: "docker"
    logs-collector:
      filters:
        - name: "grep"
          match: "*"
          params:
           - key: "exclude"
             value: ".*DEBUG.*"
        - name: "modify"
          match: "*"
          params:
           - key: "Add"
             value: "timestamp ${time}"
This configuration first filters out DEBUG logs, then adds a timestamp to the remaining logs using the modify filter.
Using Parsers with Filters
You can use parsers to structure your logs before applying filters. This is particularly useful when working with structured log formats like JSON:
config-version: 6
should-send-metrics: true
kurtosis-clusters:
  docker:
    type: "docker"
    logs-collector:
      parsers:
        - name: "json_parser"
          format: "json"
          params:
            - key: "Time_Key"
              value: "timestamp"
            - key: "Time_Format"
              value: "%Y-%m-%dT%H:%M:%S.%L"
      filters:
        - name: "parser"
          match: "*"
          params:
            - key: "Parser"
              value: "json_parser"
        - name: "grep"
          match: "*"
          params:
            - key: "exclude"
              value: "level=DEBUG"
This configuration:
- Defines a JSON parser that extracts the timestamp field and parses it
- Uses the parser filter to apply the JSON parser to all logs
- Filters out logs with DEBUG level
The match pattern uses Fluentbit's pattern matching syntax. "*" matches all logs, while more specific patterns can be used to target particular services or log types.
For more information about available filters and their parameters, refer to the Fluentbit documentation.
Local Loki and Grafloki
For ease of setup, Kurtosis CLI comes with two local logging helpers:
kurtosis loki startstarts a local Loki instance and configures the engine to send logs to it.kurtosis grafloki startstarts both Grafana and Loki and configures the engine to send logs to Loki.